
Mexico - January 2026
Economic Highlights
MEXICO | Industrial production continues to drop in annual terms. On 9 January Mexico’s national statistics institute (Inegi) released its latest index of industrial activity (Imai), reporting a monthly 0.6% increase in industrial activity in November as compared to October 2025. This is down from a monthly increase of 0.9% in October. The monthly rise in the Imai was driven by a 1.6% increase in construction and a 0.5% rise in manufacturing, while mining and utilities (electricity generation and transmission, provision of water and gas) registered no change from the previous month. However, the Imai dropped by 0.1% in yearly terms. Year-on-year, manufacturing was down 0.8% and mining decreased by 1.0%, while construction and utilities both rose, by 3.0% and 1.1% respectively.
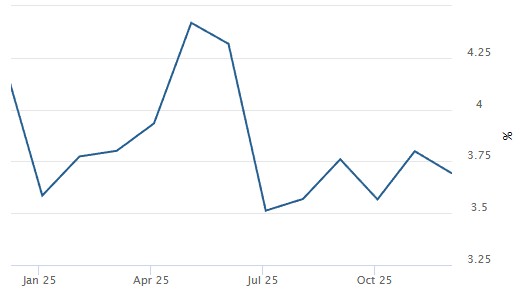
MEXICO | Inflation slows in December. On 8 January Mexico’s national statistics institute (Inegi) released the consumer price index (INPC) for December, which showed monthly inflation of 0.28% and an annual rate of 3.69%. This is down from monthly inflation of 0.66% and an annual rate of 3.80% in November. Core inflation, which excludes volatile items like food and fuel, stood at 0.41% in monthly terms and 4.33% in annual terms, up from a monthly core rate of 0.19% in November but down from an annual rate of 4.43% the previous month. Inflation remains within the central bank (Banxico)’s target of 3% with a tolerance range of +/- 1%.
MEXICO | Remittances continue downwards trend. On 2 January Mexico’s central bank (Banxico) announced that remittances sent to the country in November totalled US$5.13bn, representing a 5.7% drop year-on-year. This marks the eighth consecutive month of year-on-year declines. Accumulated remittances received between January and November 2025 totalled US$56.47bn, down 5.1% on the US$59.52bn received in the same period of 2024.
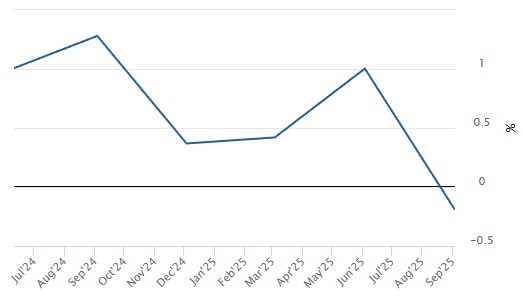
Mexico: GDP growth
Percentage variation (year-on-year)
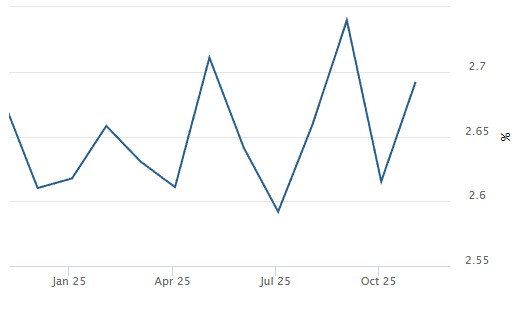
Mexico: unemployment rate
Economically active population
Mexico: inflation rate
Percentage variation (year-on-year)
Source (all graphs): National Statistics Institute (Inegi)